Comparison of the Oris Cell Migration Assay to the Scratch Assay
Cell migration is integral to many physiological processes, including embryonic development, tissue regeneration, and wound healing. In addition, cell migration is involved in tumor metastasis and atherosclerosis. One assay commonly used to study cell migration in vitro is the scratch assay. The scratch assay is performed by creating a cell-free gap, or “scratch”, on a confluent cell monolayer upon which cells at the edge of the opening move inward to close the scratch. Cell migration can be assessed by comparing images captured at the onset of the scratch creation and at user-defined intervals during scratch closure. The scratch assay is straightforward to perform and is inexpensive. However, methods for creating the scratch vary from lab to lab and results can be highly variable. Furthermore, the process of scratch formation has been shown to damage the underlying extracellular matrix (ECM).
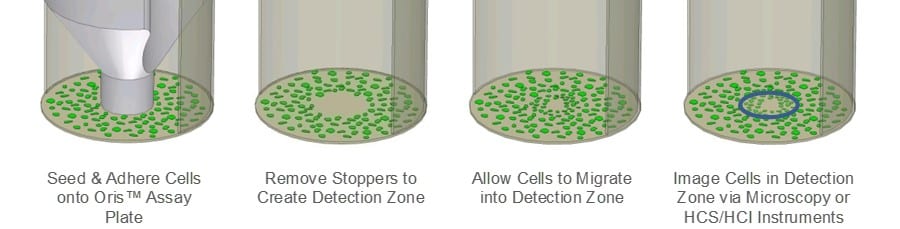
The Oris Cell Migration Assay (CMA) was designed to address the limitations of the scratch assay. The Oris CMA (Figure 1) uses a 96-well plate populated with silicone stoppers that exclude cells from the central Detection Zone of the well. After cells are seeded and allowed to adhere, the silicone stoppers are removed to reveal an unseeded region in the center of each well, into which cells are permitted to migrate. Assay reproducibility is greater in the Oris CMA compared to the scratch assay as a result of uniformly sized Detection Zones, and the underlying ECM is not damaged by the silicone stopper.
This application note offers a direct comparison of the Oris CMA and the scratch assay in assessing cell migration. Furthermore, ECM integrity is assessed in both assay formats.
Materials and Methods
All steps for the Oris CMA and the scratch assay were performed in parallel on the same day.
Oris Cell Migration Assay: Each well of a 96-well Oris TC plate was coated with 9µg/mL collagen I (Trevigen) and incubated overnight at 37oC/5%CO2. Following incubation, wells were rinsed, and Oris Cell Seeding Stoppers removed stoppers were inserted. MDA-MB-231 human breast epithelial cells (25,000 cells/100µL) were seeded into all test wells of the Oris assay plate. Once the confluent monolayer was formed, cells were serum-starved for 24 hours, stoppers were removed, and media was replaced with serum-containing media. Phase images were captured, using a Zeiss Axiovert microscope with an attached CCD camera, immediately following stopper removal to document the pre-migration area of the cell-free Detection Zone. The Oris assay plate was then placed at 37oC/5% CO2 to permit cell migration.
Scratch Assay: Each well of a Costar® 6-well plate was coated with 9µg/mL collagen I (Trevigen) and incubated overnight at 37oC/5% CO2. Following incubation, wells were rinsed, and MDA-MB-231 cells (500,000 cells/2mL) were seeded into each well of the Costar® plate. Once the confluent monolayer was formed, cells were serum-starved for 24 hours, then cell monolayers were scratched using a 1000µL pipette tip, and serum-containing media was added to each well. A sharpie marker was used to create a reference point near the scratch in each well, and phase images were captured of each scratch to document the pre-migration area of the cell-free Detection Zone. In parallel with the Oris assay plate, the scratch assay plate was placed at 37oC/5% CO2 to permit cell migration.
After 24 hours, test wells of both the Oris assay plate and scratch assay plate were fixed with 0.25% glutaraldehyde. Phase images were captured in both assays to document the migration time points. Using the reference point, the same region of the scratch from the pre-migration image was imaged. In both assay formats, cell migration was assessed by measuring the area of the Detection Zone at the pre-migration and corresponding migration time-points using ImageJ v1.42l analysis software. Cell migration is presented as percent closure, calculated using the following equation:
((Pre-migration)area – (Migration)area ) x 100 / (Pre-migration)area
ECM Integrity Assay: To test the integrity of the ECM in each assay, 100µg/mL of Collagen Type I – FITC conjugate (Sigma-Aldrich) was coated onto wells of an Oris assay plate (in the absence of stoppers) and a Costar® plate, and incubated overnight at 37oC/5% CO2. Following incubation, stoppers were inserted into the Oris assay plate and sterile PBS was added to the wells of both assay plates. At 1 hour, 24 hours, and 48 hours post-insertion, stoppers were removed, and fluorescence images were captured using a Zeiss Axiovert inverted microscope. At each aforementioned time point, scratches were made in the Costar® plate and images were captured using the same settings as those used for the Oris assay plate.
Results
MDA-MB-231 cell migration was compared on collagen I coated surfaces using two different migration assays; the Oris CMA and the scratch assay. Four separate experiments were performed in parallel on different days to compare the performance of each assay. For each independent experiment, the average area closure achieved using the Oris CMA (Figure 2A and B) ranged from 87%-89% with a coefficient of variance between 3.7-6.5% (Figure 2E). Conversely, the average area closure obtained using the scratch assay (Figure 2C and D) ranged from 69%-77% with a coefficient of variance between 11.3-25.6% (Figure 2E). These results demonstrate that the Oris CMA yields more consistent results between experiments with greater reproducibility compared to results obtained using the scratch assay.
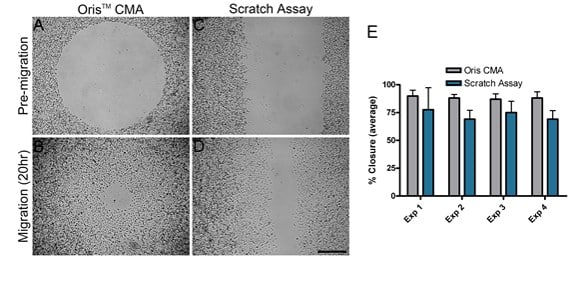
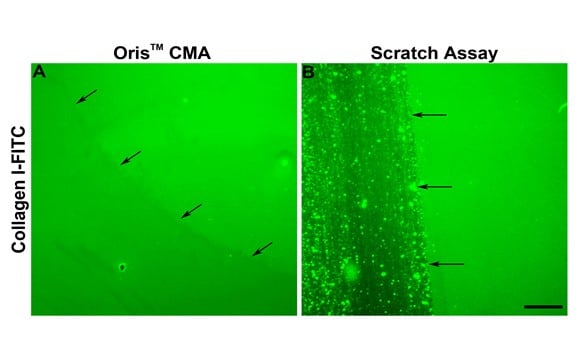
As indicated in Figure 2E, cell migration in the scratch assay was consistently less than that observed in the Oris assay. One reason for the diminished amount of cell migration in the scratch assay may be due to the damage caused to the ECM during scratch formation. Kam et al. (2008) demonstrated that the ECM can be damaged during scratch formation. To assess whether this might be true in this study, the integrity of the collagen coating following stopper removal and scratch formation was assessed. The Oris Cell Seeding Stopper did not adversely affect the collagen coating, as indicated by uniform fluorescence across the image field (Figure 3A). Conversely, using assay plates coated with FITC-labeled collagen I, the process of scratch formation damaged the collagen coating, consistent with published findings (Figure 3B). These results suggest that damage to the underlying collagen coating may contribute to the reduced cell migration observed using the scratch assay.
Conclusions
This application note compares the performance of the Oris Cell Migration Assay to the commonly used scratch assay. Results of this study demonstrate that the Oris CMA permits more consistent results between experiments with greater reproducibility compared to the scratch assay. Also, in contrast to mechanical scratch formation in the scratch assay, the use of a silicone stopper in the Oris CMA does not damage the underlying ECM. Collectively, these results illustrate the benefits of the Oris CMA over the scratch assay with regards to reproducibility and integrity of the ECM.
Learn more about Oris Cell Migration Assays.