Counting Cells in Migration Assays with ImageJ
This application note describes a method to measure cell migration, using ImageJ, by counting the number of cells that have migrated into the Detection Zone in an Oris Cell Migration Assay. ImageJ is a freeware image analysis program developed at the National Institutes of Health.
Cell migration is critical for many physiological events, including embryonic development, wound healing, and the inflammatory response. Furthermore, aberrant motile behavior of cells contributes to pathological processes including tumor metastasis and arthritis (1).
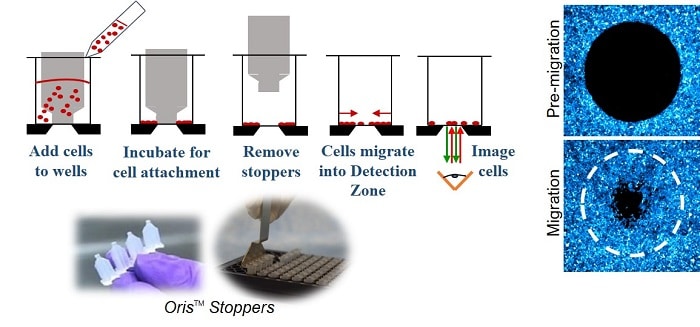
The Oris Cell Migration Assay (Figure 1) uses a 96-well plate populated with silicone stoppers that exclude cells from the central Detection Zone of the well. After cells are seeded and allowed to adhere, the silicone stoppers are removed to reveal a 2mm diameter unseeded region in the center of each well, into which cells are permitted to migrate.
METHODS
MDA-MB-231 breast epithelial cells and HT-1080 fibrosarcoma cells were cultured on an Oris™ Cell Migration Assay – TriCoated plate having Tissue Culture Treated, Collagen I coated, or Fibronectin coated wells. After 16 hours, cells were fixed with 0.25% glutaraldehyde and cell nuclei were stained with 1:2000 DAPI (Pierce). Images were acquired using a 5X objective on a Zeiss Axiovert 200 inverted microscope equipped with a CCD camera.
Cell migration into the Detection Zone was measured by counting cell number using ImageJ analysis software (version 1.42l). First, the threshold was set for each grayscale image (Image–> Adjust–> Threshold). By selecting “Apply” in the threshold window, the thresholded image was converted to a binary image. Slightly overlapping nuclei were separated by performing a Watershed segmentation process (Process–> Binary–> Watershed).
Using the binary image, a circular region-of-interest (ROI) measuring 2mm in diameter (the same diameter as the tip of the stopper) was made using the menu command Edit–> Selection–> Specify. In the Specify window, “width” and “height” were set at 2mm, and the “oval” box was checked. The ROI was centered over the Detection Zone within each well. The number of nuclei contained in the ROI was quantified using the menu command Analyze–> Analyze particles. Values to define the minimum and maximum particle size were 100 and 1000 pixels2, respectively. “Show Masks” was selected to display a drawing of the detected objects. “Summary” and “Exclude on Edges” were checked for analysis.
The cell counts from the Summary Window (i.e., counts) were exported into Windows Excel for statistical analysis. The number of nuclei for each condition was averaged from 8 wells.
RESULTS
In this application note, MDA-MB-231 and HT-1080 cell migration on three surfaces (Tissue Culture Treated, Collagen I, or Fibronectin; Oris™ Cell Migation Assay – TriCoated), was assessed by counting the number of cells in the Detection Zone using ImageJ. MDA-MB-231 cells exhibited varying degrees of migration into the Detection Zone dependent upon the surface coating of the well (Figure 2). Phase images of cells acquired immediately after stopper removal (migration control) and 16 hours after stopper removal demonstrate differences in cell migration depending upon whether cells were seeded on a Tissue Culture Treated surface, a Collagen I coated surface, or a Fibronectin coated surface (Figure 2A-D).
Using ImageJ, DAPI-labeled cells were counted by creating a 2mm circular region-of-interest (ROI) similar in size to the initial Detection Zone (Figure 2E-H). Performing the particle analysis function in ImageJ yielded drawings of detected objects that were counted within the circular ROI (Figure 2I-L). Differences in MDA-MB-231 cell migration into the Detection Zone (ROI) were highlighted by overlaying the particle analysis drawing on the original fluorescent image (Figure 2M-P).
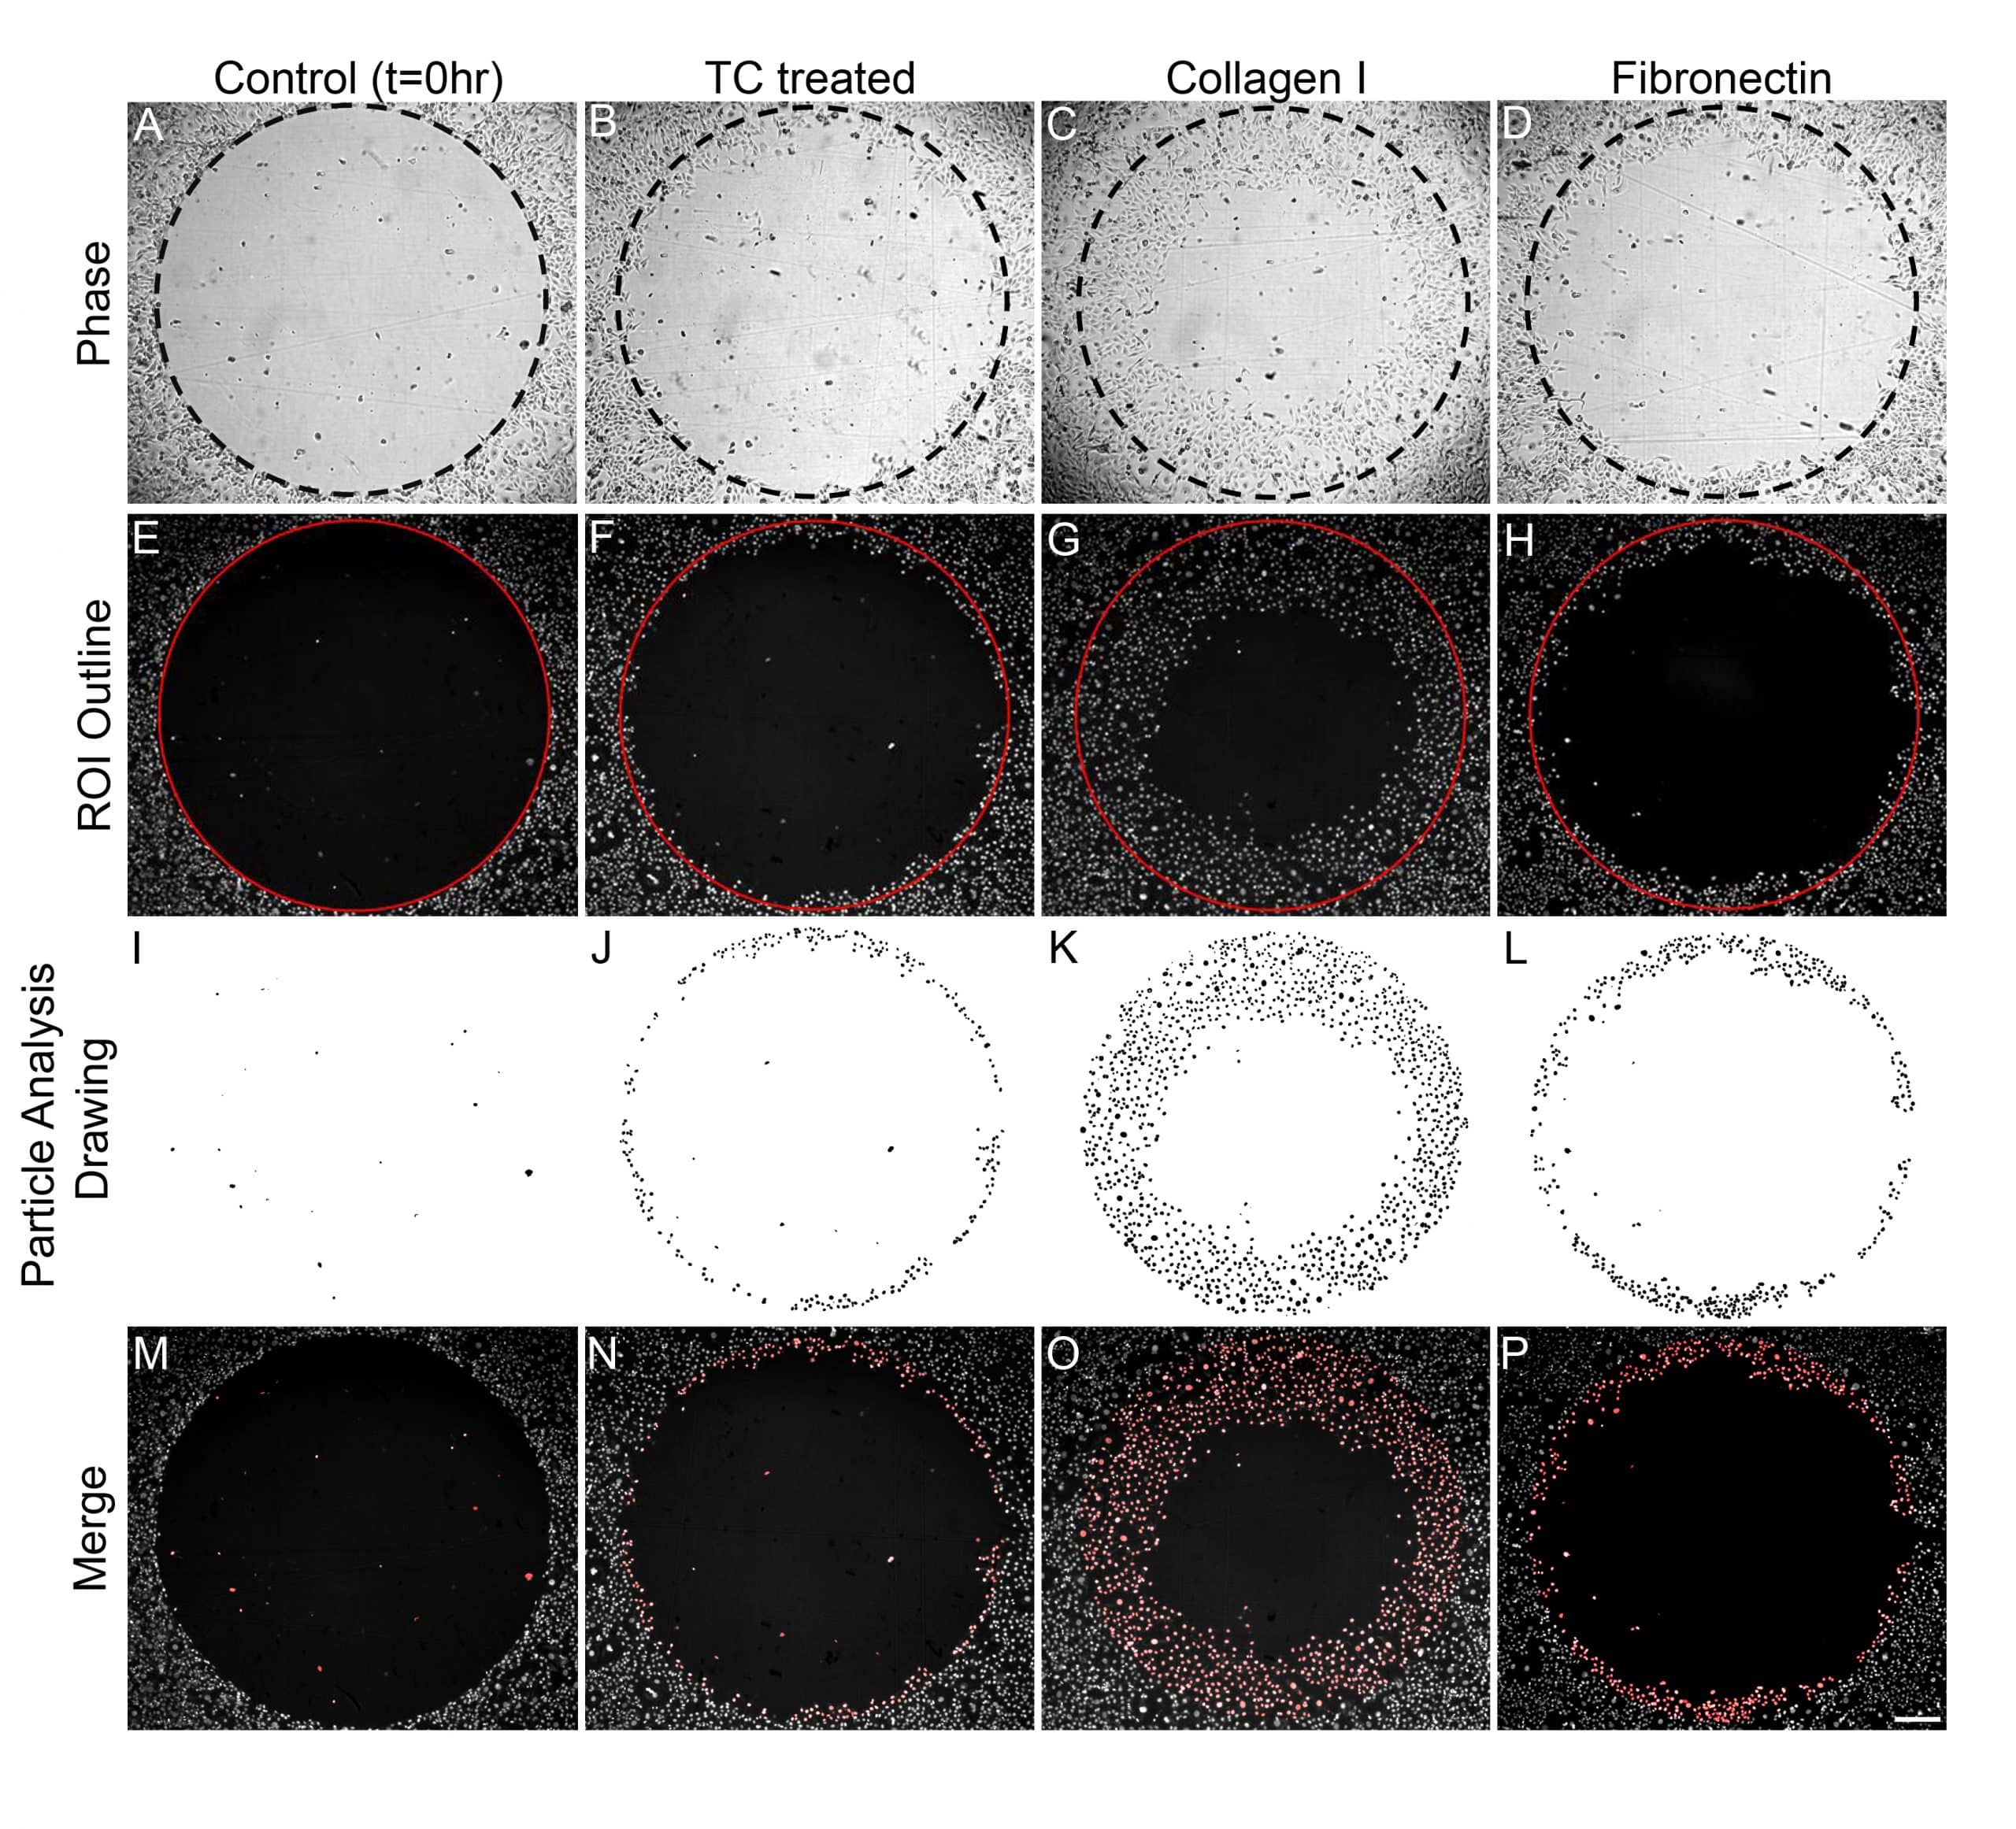
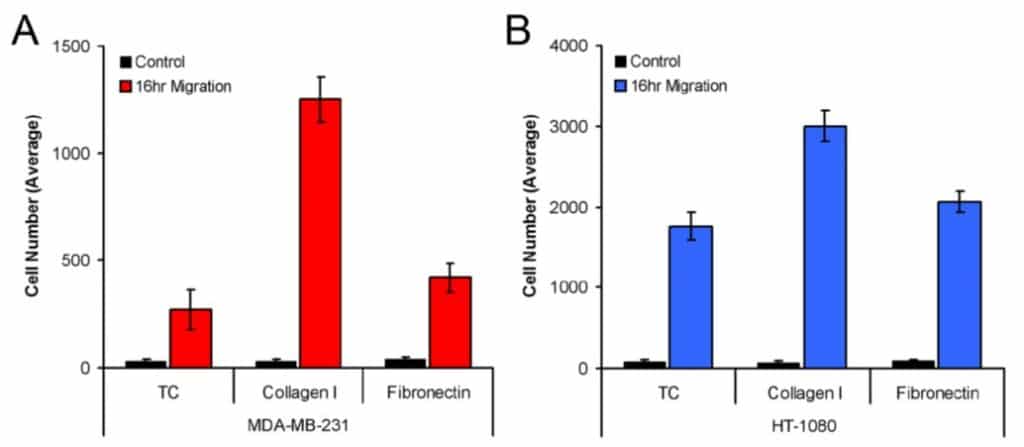
Figure 3 shows the average number of MDA-MB-231 (3A) and HT-1080 (3B) cells that migrated into the Detection Zone when seeded on Tissue Culture treated, Collagen I coated, and Fibronectin coated wells. Both MDA-MB-231 and HT-1080 cells exhibited the most robust migration on Collagen I. Furthermore, this method of analysis yielded statistical differences in the migration of model cell lines on all three plate coatings (i.e., MDA-MB-231 migration on Collagen I versus Fibronectin).
CONCLUSIONS
This application note demonstrates a method to measure cell migration in the Oris Cell Migration Assay by the use of ImageJ analysis software for counting cells. This study, using ImageJ to quantify cell number in the Detection Zone, demonstrates that both MDA-MB-231 and HT-1080 cells exhibited statistically significant differences in migration when seeded on Tissue Culture Treated, Collagen I coated, and Fibronectin coated wells. Using the detailed analysis method described here, ImageJ can provide an accurate measure of cell migration when using the Oris Cell Migration Assay.
Learn more about Oris Cell Migration Assays.