Protocol for Cell Migration Assay
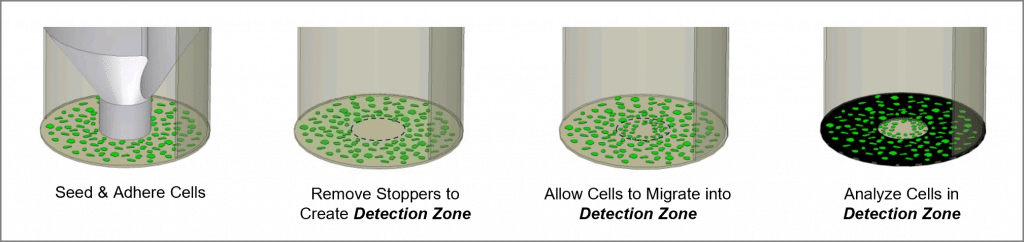
The Oris Cell Migration Assay is a reproducible, sensitive, and flexible assay that can be used to monitor cell migration. Formatted for a 96-well plate, the assay utilizes Oris Cell Seeding Stoppers made from a medical-grade silicone to restrict cell seeding to the outer annular regions of the wells. Removal of the stoppers reveals a 2-mm diameter unseeded region in the center of each well, i.e., the detection zone, into which the seeded cells may then migrate. The Oris Detection Mask is applied to the plate bottom and restricts visualization to the detection zones, allowing only cells that have migrated to be detected (see Figure 1). The Oris Cell Migration Assay is designed to be used with any commercially available stain or labeling technique. Readout can be performed by microscopy or use of a microplate reader.
Printable Protocol Files
- Tissue Culture Treated Oris™ Cell Migration Plates (CMA1.101, CMA5.101)
- Collagen I Coated Oris™ Cell Migration Plates (CMACC1.101, CMACC5.101)
- Fibronectin Coated Oris™ Cell Migration Plates (CMAFN1.101, CMAFN5.101)
Related Video: Performing a Cell Migration Assay
Materials Required
- Oris Cell Migration Assay Kit, includes the following:
- Oris 96-well plates with inserted Oris Cell Seeding Stoppers. Options for surface coating:
- Oris Detection Mask
- Oris Stopper Tool
- Biological Cells
- Sterile Phosphate-Buffered Saline (PBS) containing both Ca++ and Mg++
- Complete Cell Culture Growth Medium (containing serum)
- Sterile Pipette Tips/Pipette or Multi-Channel Pipette
- Trypsin or Cell Scraper
- Inverted Microscope (optional)
- Fluorescence Microplate Reader (optional)
- Cell Culture Labeling Medium (phenol red-free/serum-free media)
- Cell Labeling Fluorescent Agent (eg., CellTracker™ Green, Calcein AM) – required if performing assay readout via microplate reader.
Procedure for Cell Migration Assay
The following steps should be performed in a biological hood using aseptic technique to prevent contamination.
- Remove the Oris Cell Migration Assay Plate from refrigeration and place on lab bench for 1 hour to allow it to equilibrate to room temperature.
- Visually inspect the underside of the 96-well plate to ensure that the Oris Cell Seeding Stoppers are firmly sealed against the bottom of the plate. To inspect the stoppers, turn the plate over and examine the stoppers for sealing. If incomplete sealing is observed, return the plate to the upright position and use a sterile instrument to gently push the stopper back into the well until sealing is observed.
- NOTE: the sealing of the stoppers can be easily observed if the plate is tipped at an angle and viewed under indirect light to reveal the “bullseye” pattern at the bottom of each well.
- Apply the Oris Detection Mask to the bottom of the 96-well plate if microplate reader data is being collected. The Detection Mask is not necessary if collecting imaging data.
- Orient the chamfered corners of the mask with those of the 96-well plate, ensuring that the A1 corner of the mask is aligned with the A1 well of the plate.
- Align the holes in the attachment lugs with the bosses on the bottom of the 96-well plate.
- Gently press the mask until it is flush with the bottom of the 96-well plate.
- NOTE: It may be necessary to wash the mask with ethanol to remove dust and debris. The mask may be applied at any point during the assay. For kinetic assays, it is most convenient to apply the mask before any liquids are placed in the well. For endpoint assays, it is most convenient to apply the mask just before reading assay results.
- If performing a kinetic analysis of cell migration, pre-label with a fluorescent stain now.
- Collect cells and prepare a suspension that is 10-fold greater in density than the optimal seeding concentration.
- First Time Users: The optimum seeding density of cells must be determined prior to performing the cell migration assay. Please refer to Appendix I for a discussion of this process.
- Pipette 100 µL of suspended cells into each test well through one of the side ports of the Oris Cell Seeding Stopper.
- NOTE: For best results, add or extract media by placing the pipette tip along the wall of the well. Care should be taken not to disturb the Oris Cell Seeding Stopper when introducing the pipette tip into the well. A slender/elongated tip or a gel loading tip may be useful.
- IMPORTANT: Lightly tap the plate on your work surface to evenly distribute well contents (extreme tapping may result in splashing of well contents and lead to contamination).
- Incubate the seeded plate in a humidified chamber for 4 to 18 hours (cell line dependent) to permit cell attachment.
- Remove plate from incubator.
- Designate several ‘reference’ wells in which the stoppers will remain in place until results are read (t=0 pre-migration controls).
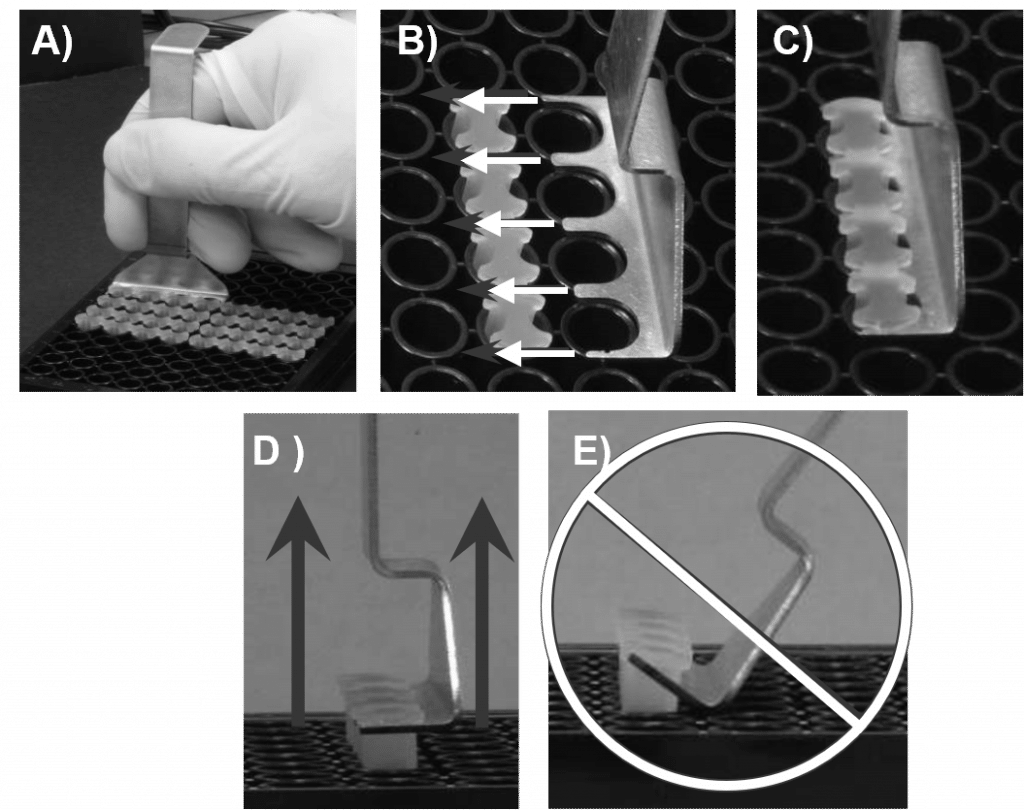
- Using the Oris Stopper Tool, remove all other stoppers (see Figure 2).
- NOTE: It may be necessary to wash the Oris Stopper Tool with 70% ethanol as the Stopper Tool is not sterile.
- Secure the 96-well plate by holding it firmly against the deck of your workspace. Slide the tines of the Oris Stopper Tool under the backbone of the stopper strip, keeping the underside of the Oris Stopper Tool flush with the top surface of the plate.
- Lift the Oris Stopper Tool vertically to gently remove the stoppers.
- DO NOT use the Oris Stopper Tool as a lever to pry the stoppers from the well (see Figure 2E). Doing so may cause displacement of seeded cells and may distort the detection zone area.
- To remove unattached cells, remove media with a pipette and gently wash wells with 100 µL of sterile PBS or media. Do not aspirate using an in-house vacuum.
- Add 100 µL of fresh culture media to each well.
- Incubate plate in a humidified chamber (37°C, 5% CO2) to permit cell migration. Cells may be examined microscopically throughout the incubation period to monitor progression of migration. Migration time will vary depending upon cell type and experimental design.
- If performing an endpoint analysis of cell migration, stain cells with a fluorescent stain after sufficient migration has occurred. Refer to Section VI and Appendix II for further information on data acquisition and fluorescence staining technique.
- NOTE: Oris Cell Seeding Stoppers are for single use only; Platypus Technologies cannot guarantee the integrity of the stopper material after a second sterilization procedure.
Data Acquisition
The readout of the Oris Cell Migration Assay can be conducted at any time, allowing the user to perform a kinetic assay or an endpoint assay. The Oris Cell Migration Assay is designed to be used with any commercially available stain or labeling technique. The readout can be performed by using a microscope, a microplate reader, or a High Content Imaging Analysis platform.
Microscope Analysis
Cell counting or image capture / analysis software, such as NIH ImageJ freeware, can be used.
- Note: Microscopy observations are possible using phase contrast or bright field microscopy.
- No need to attach the Oris Detection Mask to the Oris plate.
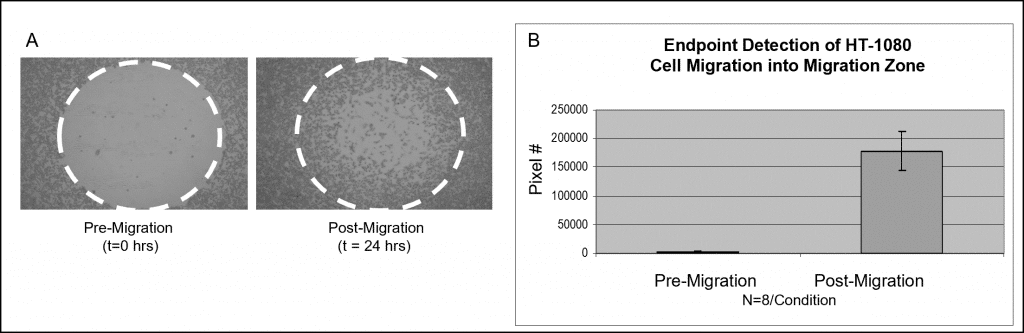
Sample data using a colorimetric stain is shown in Figure 3. Wells populated with Oris Cell Seeding Stoppers were seeded with 50,000 HT-1080 cells (i.e., 100 µL of 5×10⁵ cells/mL) and incubated overnight. The stoppers were removed from test wells but remained in place in the pre-migration reference wells until the time of the assay readout. The seeded plate was incubated in a humidified chamber for 24 hours to permit cell migration. Stoppers were removed from the reference wells and all cells were fixed and treated with Wright-Giemsa stain. Images were captured using bright field microscopy and then imported to Image J software for analysis using thresholding. The images below, captured without a detection mask in place, illustrate representative data from pre-migration (t=0 hrs.) and post-migration (t=24 hrs.) wells (Figure 3A). The graph depicts the average pixel number in the detection zones for each condition (Figure 3B).
Microplate Reader Analysis
- Attach the Oris Detection Mask to the bottom of the Oris plate (refer to Section V, step 3).
- Optimal settings will vary according to the microplate reader make and model. Consult Appendix II and the equipment user manual for your particular instrument.
- The microplate reader MUST be set to read from the bottom of the plate.
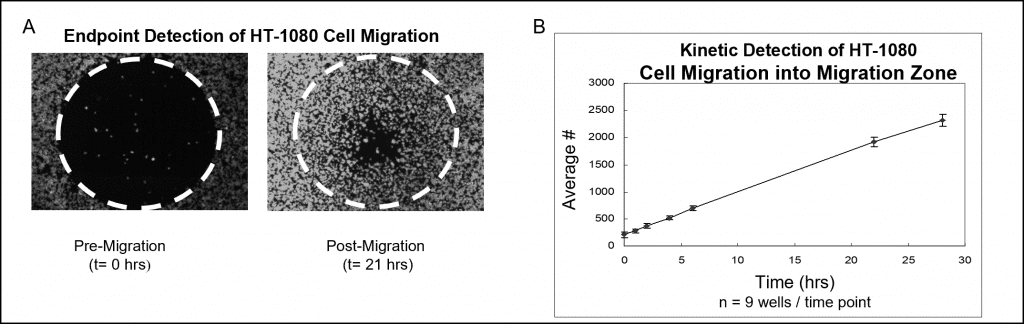
Sample data using a fluorescent stain and microplate reader analysis are shown in Figure 4. Wells populated with Oris Cell Seeding Stoppers were seeded with 50,000 HT-1080 cells (i.e., 100 μL of 5×10⁵ cells/mL) and incubated overnight. The stoppers were removed from test wells but remained in place in the pre-migration reference wells until the time of the assay readout. Cells were fluorescently stained with CellTracker Green. The seeded plate was incubated in a humidified chamber for 28 hours and at various time points the fluorescence signals in the detection zones were measured using a plate reader. The images below (Figure 4A), captured without a detection mask in place, illustrate representative data from pre-migration (t=0 hrs.) and post-migration (t = 21 hrs.) wells. The graph depicts a real-time analysis of cell migration that was prepared by transposing the fluorescent signal into cell numbers (Figure 4B).
APPENDIX I: Determining Optimal Concentration of Cells
This procedure is intended to assist in determining the cell seeding density needed to achieve confluency of your cell line when using the Oris™ Cell Migration Assay. The intended goal is to achieve 90-95% confluency of the monolayer surrounding the Oris™ Cell Seeding Stoppers without overgrowth.
- A suggested starting point is to evaluate three serial dilutions at the cell densities shown below. The cell seeding area of the well with the stopper in place is ~ 0.3 cm2. Based on the typical seeding density of your particular cell line, you can infer a different cell number for your first serial dilution and adjust the numbers below accordingly.
- Prepare a log-phase culture of the cell line to be tested. Collect cells and determine the total number of cells present.
- Pellet cells by centrifugation. Prepare three serial dilutions at final concentrations of 1.0 x 10⁶, 0.5 x 10⁶ and 0.25 x 10⁶ cells/mL.
- Dispense 100 µL of cell suspension per well into the 96-well plate to result in the following plate layout:
- Column #1: 100,000 cells per well (8 wells)
- Column #2: 50,000 cells per well (8 wells)
- Column #3: 25,000 cells per well (8 wells)
- Incubate the plate in a humidified chamber (37°C, 5% CO2) for 4 – 18 hours (cell line dependent) with cell seeding stoppers in place to allow the cells to firmly attach to the well surface.
- Following cell attachment, remove the Oris Cell Seeding Stoppers from each well (see Figure 5) and gently wash the wells with PBS to remove non-attached cells.
- Secure the 96-well plate by holding it firmly against the deck of your workspace. Slide the tines of the Oris Stopper Tool under the backbone of the stopper strip, keeping the underside of the tool flush with the top surface of the plate.
- Lift the Oris Stopper Tool vertically to gently remove the stopper. Do not use the Oris Stopper Tool as a lever to pry the stoppers from the well as doing so may cause displacement of the seeded cells.
- Without a Detection Mask in place, use a microscope to visually inspect each well to determine the minimum cell seeding concentration that yields a confluent monolayer at the perimeter of the detection zone.
At this point, you have successfully determined the optimal cell seeding concentration to be used in Step 5 of the Cell Migration Assay Protocol.
APPENDIX II: Determining Optimal Settings for Microplate Reader
This procedure is intended to assist in optimizing your instrument’s settings when using a fluorescence microplate reader to capture data from the Oris Cell Migration Assay.
- Using the optimal cell seeding concentration, perform a cell migration assay using culture conditions expected to result in robust cell migration. Be sure to include equal numbers of pre-migration reference wells (stoppers left in place until staining) and post-migration test wells (stoppers removed after cell attachment period). A minimum of 8 wells per condition are recommended.
- Perform the desired fluorescent staining technique. The Oris Cell Migration Assay has been designed to work with all types of fluorescent stains and staining techniques. The precise method for staining cells with fluorescent stains varies according to the nature of the individual stain. It is important to stain cells using a fluorescent reagent that uniformly stains cells. Probes affected by experimental conditions will increase variability of results and reduce correlation between fluorescence signal and cell migration. Please consult the manufacturer of your fluorescent stain for specific considerations. The following is an example Fluorescent Staining Protocol for using Calcein AM:
- To stain one fully seeded plate, combine 5 μL of Calcein AM (1 mg/mL in dry DMSO) with 10 mL of phenol red-free and serum-free media, or 1x PBS (containing both Ca++ and Mg++). Protect diluted Calcein AM solution from light until ready to use in step d.
- Carefully remove culture medium from wells.
- Wash wells with 100 μL of PBS (containing both Ca++ and Mg++). Add 100 μL of diluted Calcein AM solution to each well. Incubate plate at 37°C for 30 – 60 minutes.
- Attach mask and read promptly with microplate reader using appropriate filter set and sensitivity/gain settings. For a BioTek Synergy™ HT microplate reader, use 485/528 nm excitation/emission filters, sensitivity 55 nm.
- If not already in place, apply the Oris Detection Mask to the plate. Using the bottom probe of a fluorescence microplate reader, obtain the fluorescence reading from each well. To optimize the dynamic range, adjust the instrument’s gain to maximize the difference in fluorescence signal between pre-migration and post-migration wells. Refer to the instrument manual for your microplate reader for further guidance on instrument settings.
You have now successfully determined the optimal cell seeding concentration and microplate reader settings for analysis of cell migration.
See additional tips in our Frequently Asked Questions.